Scientists using the Karl G. Jansky Very Large Array (VLA) at the National Radio Astronomy Observatory have produced detailed radio maps of Jupiter’s atmosphere, revealing that features seen in visible light at the gas giant’s cloud surfaces have effects tens of miles downward.
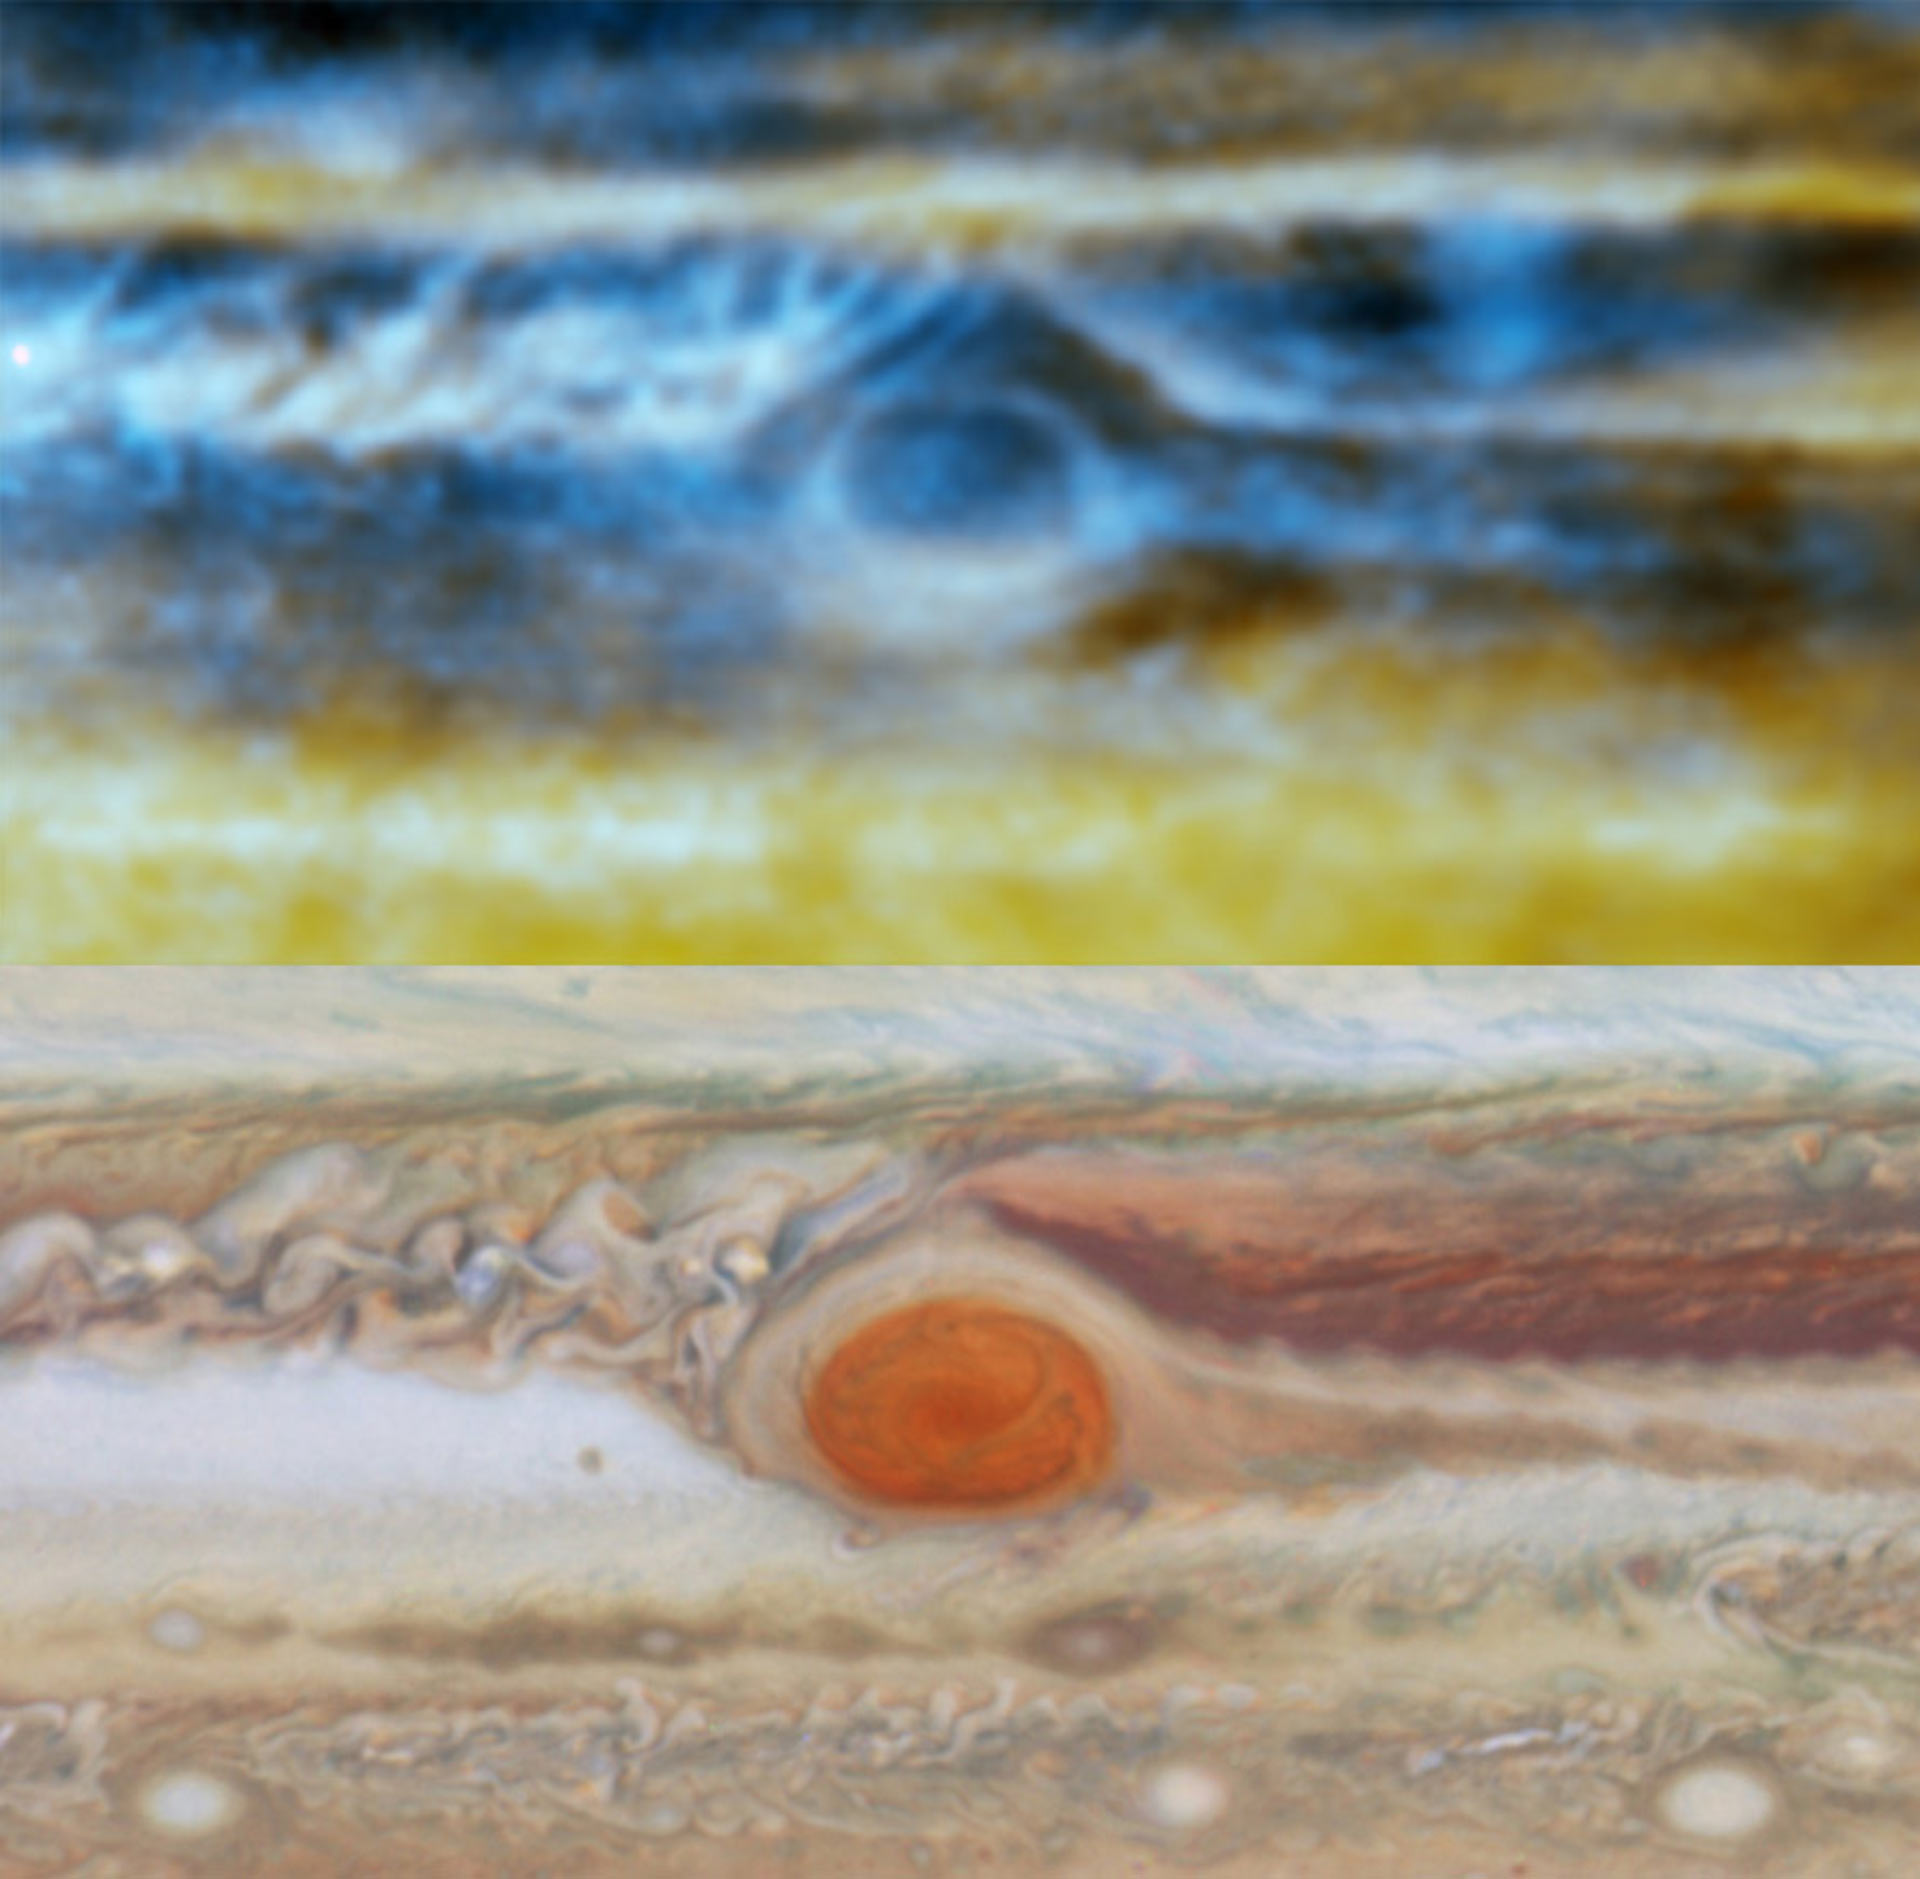
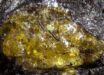
Radio image (top), made with the VLA, and optical image (bottom) made with the NASA/ESA Hubble Space Telescope, of Jupiter’s Great Red Spot. The radio image shows the complex upwellings and downwellings of ammonia gas 18-56 miles (30-90 km) below the visible clouds. Image credit: Imke de Pater et al / NRAO / AUI / NSF / NASA / ESA.
“This region was previously unexplored,” said Prof. Imke de Pater from the University of California, Berkeley, lead author of a study published in the journal Science today.
Previous radio studies of Jupiter have been limited to analyzing its properties at specific latitudes, but the new observations offer a widespread, comprehensive view of activity below the clouds.
To acquire detailed data, Prof. de Pater and colleagues used the recently upgraded VLA radio telescope, detecting a range of radio frequencies from the atmosphere of the giant planet.
“These observations give us important new information about the temperatures, pressures, and motions of gas at these levels of the atmosphere,” Prof. de Pater said.
In order to make sensitive radio images, multi-antenna telescopes such as the VLA must gather the radio waves emitted by an object for a significant amount of time. However, Jupiter rotates so swiftly that a conventional radio image would be smeared in just a few minutes.
To overcome this obstacle, the team took advantage of the added sensitivity of VLA, then developed an innovative data-reduction technique to ‘unsmear’ the data from many hours of observing.
“Jupiter’s rotation once every ten hours usually blurs radio maps, because these maps take many hours to observe. But we have developed a technique to prevent this and so avoid confusing together the upwelling and downwelling ammonia flows, which had led to the earlier underestimate,” explained co-author Dr. Robert Sault, from the University of Melbourne.
The results showed a level of detail that provided new insights into the structure and dynamics of the Jupiter’s atmosphere.
“We were able to make maps of Jupiter as seen at different radio wavelengths, then compare these to visible-light images made at nearly the same times,” said co-author Dr. Bryan Butler, of the National Radio Astronomy Observatory.
“We created a 3D picture of ammonia gas in Jupiter’s atmosphere, which reveals upward and downward motions within the turbulent atmosphere. The maps bear a striking resemblance to visible-light images taken by amateur astronomers and Hubble,” Prof. de Pater added.
The VLA maps show ammonia-rich gases rising into and forming the upper cloud layers: an ammonium hydrosulfide cloud at a temperature near minus 100 degrees Fahrenheit (minus 73 degrees Celsius) and an ammonia-ice cloud in the approximately minus 172 degree Fahrenheit cold air (minus 113 degrees Celsius). These clouds are easily seen from Earth by optical telescopes.
Conversely, the radio maps show ammonia-poor air sinking into the planet, similar to how dry air descends from above the cloud layers on Earth.
The maps also show that hotspots (they appear bright in radio and thermal infrared images) are ammonia-poor regions that encircle the giant planet like a belt just north of the equator.
Between these hotspots are ammonia-rich upwellings that bring ammonia from deeper in the planet.
“With radio, we can peer through the clouds and see that those hotspots are interleaved with plumes of ammonia rising from deep in the planet, tracing the vertical undulations of an equatorial wave system,” said co-author Dr. Michael Wong, from the University of California, Berkeley.
“We now see high ammonia levels like those detected by Galileo from over 60 miles (100 km) deep, where the pressure is about eight times Earth’s atmospheric pressure, all the way up to the cloud condensation levels,” Prof. de Pater added.
The results shed new light on the atmospheres of giant gaseous planets, and will provide important context for NASA’s Juno spacecraft, which is scheduled to arrive at Jupiter in July 2016.
_____
Imke de Pater et al. 2016. Peering through Jupiter’s clouds with radio spectral imaging. Science, vol. 352, no. 6290, pp. 11981201; doi: 10.1126/science.aaf2210