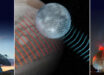
Scientists with NASA’s Dawn mission have released new color-coded maps of Ceres showing the highs and lows of topography on the dwarf planet’s surface and global compositional variations.

This color-coded map from NASA’s Dawn mission shows the highs and lows of topography on the surface of the dwarf planet Ceres. It is labeled with names of features approved by the International Astronomical Union. The color scale extends 5 miles (7.5 km) below the reference surface in indigo to 5 miles (7.5 km) above the reference surface in white. Ysolo Mons lies high in the northern hemisphere at upper left. Image credit: NASA / JPL-Caltech / UCLA / MPS / DLR / IDA.
A new color-coded topographic map of Ceres shows more than a dozen recently approved names for features on Ceres, all eponymous for agricultural spirits, deities and festivals from cultures around the world.
These include Jaja, after the Abkhazian harvest goddess, and Ernutet, after the cobra-headed Egyptian harvest goddess.
A 12-mile (20-km) diameter mountain near Ceres’ north pole is now called Ysolo Mons, for an Albanian festival that marks the first day of the eggplant harvest.
Ceres’ mysterious bright spots retain their bright appearance in this map, although they are color-coded in the same green elevation of the crater floor in which they sit.
This map was constructed from analyzing images from Dawn’s framing camera taken from varying Sun and viewing angles. The map was combined with an image mosaic of Ceres and rendered as a simple cylindrical projection.

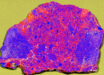
This map, made from data obtained by NASA’s Dawn spacecraft, shows the mineral distribution on the surface of Ceres. Image credit: NASA / JPL-Caltech / UCLA / MPS / DLR / IDA.
“The irregular shapes of craters on Ceres are especially interesting, resembling craters we see on Saturn’s icy moon Rhea. They are very different from the bowl-shaped craters on Vesta,” said team member Dr Carol Raymond of NASA’s Jet Propulsion Laboratory in Pasadena, California.
Another new map of Ceres enhances compositional differences present on the planet’s surface. It was created from images taken by Dawn during its high-altitude mapping orbit in August and September, 2015. Images taken using IR (920 nm), red (750 nm) and blue (440 nm) filters were combined to create this view.
The Dawn scientists also created color-coded topographic maps of Occator, home of Ceres’ mysterious bright spots, and a puzzling, cone-shaped 4-mile (6 km) high mountain.

This is a color-coded topographic map of Occator crater. Blue is the lowest elevation, and brown is the highest. Image credit: NASA / JPL-Caltech / UCLA / MPS.
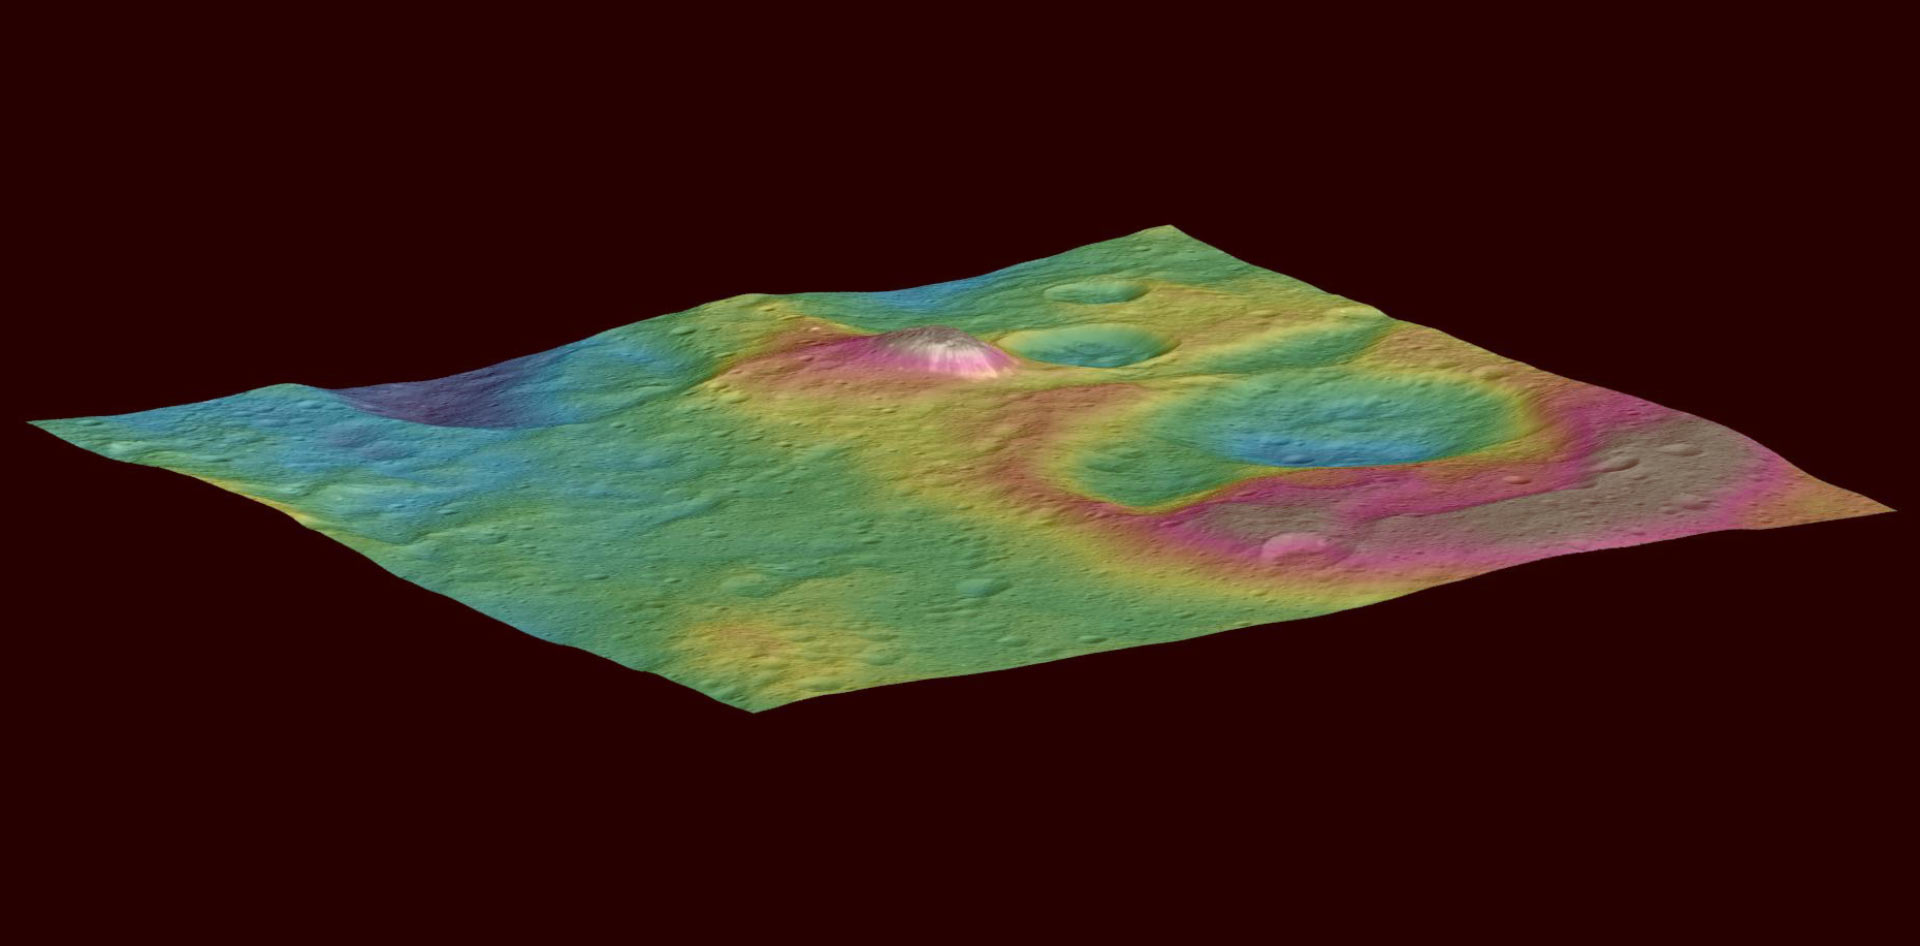
This view features a tall conical mountain on Ceres. Elevations span a range of about 5 miles (8 km) from the lowest places in this region to the highest terrains. Blue represents the lowest elevation, and brown is the highest. The white streaks seen running down the side of the mountain are especially bright parts of the surface. Image credit: NASA / JPL-Caltech / UCLA / MPS / DLR / IDA / PSI.
“Ceres continues to amaze, yet puzzle us, as we examine our multitude of images, spectra and energetic particle bursts,” said Dr Chris Russell of the University of California, Los Angeles, Dawn’s principal investigator.
The new maps of Ceres will be also presented at the European Planetary Science Conference in Nantes, France, this week.
_____
N. Schmedemann et al. Ceres and Rhea: Comparison of the Cratering Records of Two Icy Bodies. EPSC Abstracts, vol. 10, EPSC2015-367
F. Zambon et al. Color variations on Ceres derived by Dawn/VIR: Implications for the surface composition. EPSC Abstracts, vol. 10, EPSC2015-525
P. Schenk et al. Impact Craters on Ceres: Evidence for Water-Ice Mantle? EPSC Abstracts, vol. 10, EPSC2015-400