BedMachine Antarctica is a new bed topography map based on ice thickness data from different research institutes dating back to 1967, encompassing nearly a million line-miles of radar soundings.

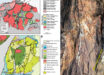
Bed elevation of the Antarctic ice sheet color coded between minus 2 and 1 km (minus 1.2 and 0.6 miles) above sea level. The white lines delineate the basins from the ice sheet mass balance inter-comparison exercise (IMBIE). Image credit: Morlighem et al, doi: 10.1038/s41561-019-0510-8.
“There were lots of surprises around the continent, especially in regions that had not been previously mapped in great detail with radar,” said Dr. Mathieu Morlighem, a researcher in the Department of Earth System Science at the University of California, Irvine.
“Using BedMachine to zoom into particular sectors of Antarctica, you find essential details such as bumps and hollows beneath the ice that may accelerate, slow down or even temporarily stop the retreat of glaciers.”
Previous Antarctica mapping methods relying on radar soundings have been generally effective, with some limitations.
Alternatively, BedMachine relies on the fundamental physics-based method of mass conservation to estimate what lies between the radar sounding lines, utilizing highly detailed information on ice flow motion from satellite data that dictates how ice moves around the varied contours of the bed.
“Ultimately, BedMachine Antarctica presents a mixed picture: ice streams in some areas are relatively well-protected by their underlying ground features, while others on retrograde beds are shown to be more at risk from potential marine ice sheet instability,” Dr. Morlighem said.

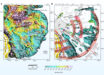
Detailed bed topography of Antarctic outlet glaciers: (a-l) bed elevation of Thwaites (a) and Kohler, Smith and Pope (b) glaciers, Shirase coast (c), Byrd and Mulock glaciers (d), David (e) and Ninnis and Mertz (f) glaciers, Totten glacier (g), Denman (h) and Lambert (i) glaciers, Roi Baudouin Ice Shelf (j), Recovery (k) and Evans (l) Ice Streams, color coded between minus 2 and 1 km (minus 1.2 and 0.6 miles) above sea level. The black lines show the ice extent and the white lines the grounding lines. Gl – Glacier. Image credit: Morlighem et al, doi: 10.1038/s41561-019-0510-8.
Dr. Morlighem and colleagues utilized ice thickness data from 19 different research institutes, ice shelf bathymetry measurements from NASA’s Operation IceBridge campaigns, as well as seismic information.
Among the most striking results the scientists obtained are:
(i) the discovery of stabilizing ridges that protect the ice flowing across the Transantarctic Mountains;
(ii) a bed geometry that increases the risk of rapid ice retreat in the Thwaites and Pine Island glaciers sector of West Antarctica;
(iii) a bed under the Recovery and Support Force glaciers that is hundreds of meters deeper than previously thought, making those ice sheets more susceptible to retreat;
(iv) and the world’s deepest land canyon below Denman Glacier in East Antarctica.
“Older maps suggested a shallower canyon, but that wasn’t possible; something was missing,” Dr. Morlighem said.
“With conservation of mass, by combining existing radar survey and ice motion data, we know how much ice flows through the canyon — which, by our calculations, reaches 3.5 km (1.86 miles) below sea level, the deepest point on land.”
“Since it’s relatively narrow, it has to be deep to allow that much ice mass to reach the coast.”
The BedMachine Antarctica map is described in a paper in the journal Nature Geoscience.
_____
M. Morlighem et al. Deep glacial troughs and stabilizing ridges unveiled beneath the margins of the Antarctic ice sheet. Nat. Geosci, published online December 12, 2019; doi: 10.1038/s41561-019-0510-8