The new map of WASP-18b, a hot-Jupiter exoplanet located approximately 325 light-years from Earth, reveals an atmosphere with distinct temperature zones — one so scorching that it breaks down water vapor.
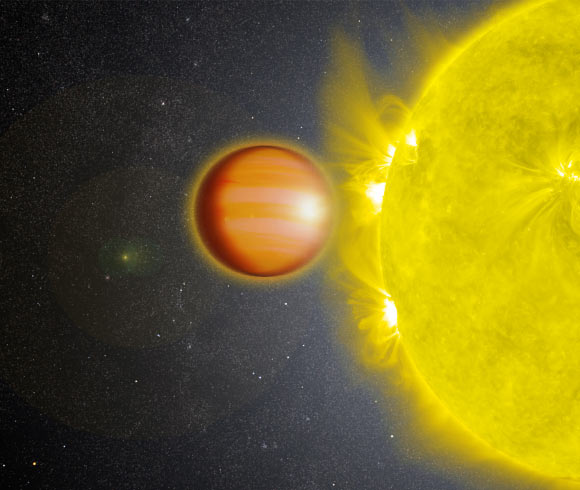
The hot-Jupiter WASP-18b. Image credit: NASA’s Goddard Space Flight Center.
The map of WASP-18b is the first applying a technique called 3D eclipse mapping, or spectroscopic eclipse mapping.
This study builds on a 2D model that members of the same team published in 2023, which demonstrated eclipse mapping’s potential to tap into highly sensitive observations by the NASA/ESA/CSA James Webb Space Telescope.
“This technique is really the only one that can probe all three dimensions at once: latitude, longitude and altitude,” said Dr. Megan Weiner Mansfield, an astronomer at the University of Maryland and Arizona State University.
“This gives us a higher level of detail than we’ve ever had to study these celestial bodies.”
Using this technique, the astronomer can now begin mapping atmospheric variations for many similar types of exoplanets observable by Webb, just as Earth-based telescopes long ago observed Jupiter’s Great Red Spot and banded cloud structure.
“Eclipse mapping allows us to image exoplanets that we can’t see directly, because their host stars are too bright,” said Dr. Ryan Challener, an astronomer at Cornell University and the University of Maryland.
“With this telescope and this new technique, we can start to understand exoplanets along the same lines as our solar system neighbors.”
Detecting exoplanets at all is difficult — they typically emit much less than 1% of a host star’s brightness.
Eclipse mapping requires measuring small fractions of that total as a planet circles behind its star, obscuring and revealing parts of it along the way.
Scientists can link minute changes in light to specific regions to produce a brightness map that, when done in multiple colors, can be converted to temperatures in three dimensions: latitude, longitude and altitude.
“You’re looking for changes in tiny portions of the planet as they disappear and reappear into view, so it’s extraordinarily challenging,” Dr. Challener said.
WASP-18b, which has roughly the mass of 10 Jupiters, orbits in just 23 hours and has temperatures approaching 2,760 degrees Celsius (5,000 degrees Fahrenheit) — provided a relatively strong signal, making it a good test case for the new mapping technique.
While the earlier 2D map utilized a single light wavelength, or color, the 3D map re-analyzed the same observations from Webb’s Near-Infrared Imager and Slitless Spectrograph (NIRISS) instrument in many wavelengths.
“Each color corresponded to different temperatures and altitudes within WASP-18b’s gaseous atmosphere that could be pieced together to create the 3D map,” Dr. Challener said.
“If you build a map at a wavelength that water absorbs, you’ll see the water deck in the atmosphere, whereas a wavelength that water does not absorb will probe deeper.”
“If you put those together, you can get a 3D map of the temperatures in this atmosphere.”
The new view confirmed spectroscopically distinct regions — differing in temperature and possibly in chemical composition — in WASP-18b’s visible dayside, the side always facing the star due to its tidally locked orbit.
The planet features a circular ‘hotspot’ where the most direct starlight lands, and where winds apparently aren’t strong enough to redistribute the heat.
Surrounding the hotspot is a colder ‘ring’ nearer the planet’s outer visible edges, or limbs.
Notably, the measurements showed lower levels of water vapor in the hotspot than WASP-18b’s average.
“We think that’s evidence that the planet is so hot in this region that it’s starting to break down the water,” Dr. Challener said.
“That had been predicted by theory, but it’s really exciting to actually see this with real observations.”
“Additional Webb observations could help improve the first 3D eclipse map’s spatial resolution.”
“Already the technique can help illuminate the temperature maps of other hot Jupiters, which make up hundreds of the more than 6,000 exoplanets confirmed to date.”
“It’s very exciting to finally have the tools to see and map out the temperatures of a different planet in this much detail,” Dr. Mansfield said.
“It’s set us up to possibly use the technique on other types of exoplanets. For example, if a planet doesn’t have an atmosphere, we can still use the technique to map the temperature of the surface itself to possibly understand its composition.”
“Although WASP-18b was more predictable, I believe we will have the chance to see things that we could never have expected before.”
The map of WASP-18b was published in a paper in the journal Nature Astronomy.
_____
R.C. Challener et al. Horizontal and vertical exoplanet thermal structure from a JWST spectroscopic eclipse map. Nat Astron, published online October 28, 2025; doi: 10.1038/s41550-025-02666-9