On its way to assembling the most detailed 3D map ever made of our Galaxy, ESA’s Gaia spacecraft has pinned down the precise position on the sky and the brightness of 1.142 billion stars, and in addition measured the velocity and distance of two million of them relative to the Sun.

An all-sky view of stars in the Milky Way and neighboring galaxies, based on the first year of observations from ESA’s Gaia satellite, from July 2014 to September 2015. This map shows the density of stars observed by Gaia in each portion of the sky. Brighter regions indicate denser concentrations of stars, while darker regions correspond to patches of the sky where fewer stars are observed. The two bright objects in the lower right of the image are the Large and Small Magellanic Clouds, two dwarf galaxies orbiting the Milky Way. Other nearby galaxies are also visible, most notably Andromeda (also known as M31), the largest galactic neighbor to the Milky Way, in the lower left of the image. Below Andromeda is its satellite, the Triangulum galaxy (M33). A number of artifacts are also visible on the image. These curved features and darker stripes are not of astronomical origin but rather reflect Gaia’s scanning procedure. As this map is based on observations performed during the mission’s first year, the survey is not yet uniform across the sky. These artifacts will gradually disappear as more data are gathered during the five-year mission. Image credit: ESA / Gaia / DPAC / A. Moitinho & M. Barros, CENTRA – University of Lisbon.
Launched on December 19, 2013, ESA’s Gaia spacecraft both rotates and orbits around the Earth, while surveying the sky with its two telescopes.
Equipped with 106 CCDs forming the equivalent of a camera with a resolution of a billion pixels, it surveys 50 million stars per day, each time carrying out ten measurements, which represents a total of 500 million data points per day.
This huge amount of information has been used to draw up a catalog of the positions in the sky of 1.142 billion stars. The precision ranges from 0.5 to 15 milliarcseconds.
“The beautiful map we are publishing today shows the density of stars measured by Gaia across the entire sky, and confirms that it collected superb data during its first year of operations,” said Gaia project scientist Dr. Timo Prusti, from ESA.
The stripes and other artifacts in the map reflect how Gaia scans the sky, and will gradually fade as more scans are made during the five-year mission.
“The satellite is working well and we have demonstrated that it is possible to handle the analysis of a billion stars,” Dr. Prusti said.
“Although the current data are preliminary, we wanted to make them available for the astronomical community to use as soon as possible.”
Including 200 million more stars than initially planned, the full billion-star catalog will enable researchers to compile valuable statistics about various types of bodies, which would be impossible without such a huge survey.
For instance, the catalog contains data for 250,000 quasars, as well as for 3,000 Cepheid and RR Lyrae variable stars.
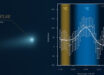
The Gaia mission has provided the light curves of the variable stars, in other words, the changes in their brightness, which will help astronomers to shed light on the physical processes governing these stars.
“Variable stars like Cepheids and RR Lyraes are valuable indicators of cosmic distances,” said Dr. Gisella Clementini from the Istituto Nazionale di Astrofisica (INAF) and the Astronomical Observatory of Bologna, Italy.
“While parallax is used to measure distances to large samples of stars in the Milky Way directly, variable stars provide an indirect, but crucial step on our ‘cosmic distance ladder,’ allowing us to extend it to faraway galaxies.”

Gaia’s map, annotated. Image credit: ESA / Gaia / DPAC / A. Moitinho & M. Barros, CENTRA – University of Lisbon.
The astronomers also looked in detail at the roughly two million stars in common between Gaia’s first year and the earlier catalogues from ESA’s Hipparcos mission, which charted the sky more than two decades ago.
By combining Gaia data with information from these less precise catalogues, it was possible to start disentangling the effects of ‘parallax’ and ‘proper motion’ even from the first year of observations only. Parallax is a small motion in the apparent position of a star caused by Earth’s yearly revolution around the Sun and depends on a star’s distance from us, while proper motion is due to the physical movement of stars through the Galaxy.
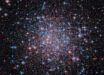
“With Hipparcos, we could only analyze the 3D structure and dynamics of stars in the Hyades, the nearest open cluster to the Sun, and measure distances for about 80 clusters up to 1,600 light-years from us,” said Dr. Antonella Vallenari, from INAF and the Astronomical Observatory of Padua, Italy.
“But with Gaia’s first data, it is now possible to measure the distances and motions of stars in about 400 clusters up to 4,800 light-years away.”
“For the closest 14 open clusters, the new data reveal many stars surprisingly far from the center of the parent cluster, likely escaping to populate other regions of the Galaxy.”
Fifteen scientific papers describing the new data and their validation process will appear in a special issue of the journal Astronomy & Astrophysics.