A team of scientists from Canada and France has produced a three-dimensional density map of galaxies that spans approximately 2 billion light-years.

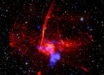
A slice through the map of nearby galaxy superclusters; the map spans nearly 2 billion light years from side to side. Regions with many galaxies are shown in white or red, whereas regions with fewer galaxies are dark blue. Image credit: University of Waterloo, adapted by Sci-News.com.
The lighter blue and white areas on the map represent greater concentrations of galaxies.
The red area is the supercluster (cluster of groups of galaxies) called the Shapley Concentration, (Shapley Supercluster), the largest collection of galaxies in the nearby Universe.
The map also shows gigantic groupings of galaxies known as the Virgo Supercluster, Hydra–Centaurus Supercluster, and Perseus-Pisces Supercluster.
Unexplored areas appear in medium blue.
“The galaxy distribution isn’t uniform and has no pattern,” said Prof Mike Hudson the University of Waterloo, who is the senior author of the paper in the Monthly Notices of the Royal Astronomical Society.
“It has peaks and valleys much like a mountain range. This is what we expect if the large-scale structure originates from quantum fluctuations in the early Universe.”
Knowing the location and motion of matter in the Universe will help scientists predict expansion of the Universe and identify where and how much dark matter exists.
Astronomers have observed that galaxies move differently because the Universe’s expansion is not even. These differences are called peculiar velocities. Our Milky Way Galaxy and its neighbor, the Andromeda galaxy, are moving with a speed of 2 million km per hour. Previous models haven’t fully accounted for this observed motion.
Prof Hudson and co-authors are interested in discovering what structures are responsible for the peculiar velocities.
These deviations in the motion of galaxies are a valuable tool to determine the distribution of matter and dark matter on the largest scales.
“A better understanding of dark matter is central to understanding the formation of galaxies and the structures they live in, such as galaxy clusters, superclusters and voids,” Prof Hudson said.
_____
Jonathan Carrick et al. 2015. Cosmological parameters from the comparison of peculiar velocities with predictions from the 2M++ density field. MNRAS 450 (1): 317-332; doi: 10.1093/mnras/stv547