After nine years of gathering, cleaning, processing and interpolating data, an international team of researchers this week released the second version of the International Bathymetric Chart of the Southern Ocean (IBCSO v2).

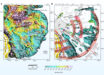
The International Bathymetric Chart of the Southern Ocean Version 2 (IBCSO v2) is a digital bathymetric model for the area south of 50° S with special emphasis on the bathymetry of the Southern Ocean. Image credit: Dorschel et al.
The Southern Ocean is a major component of the coupled ocean-atmosphere climate system and includes the largest ocean current on Earth, the Antarctic Circumpolar Current.
It is furthermore the most important ocean region for the uptake of anthropogenic carbon dioxide and heat from the atmosphere and cold and dense bottom waters form on the shelves surrounding Antarctica.
Interactions of the Southern Ocean with Antarctic glaciers and ice shelves are the main drivers of present, past, and future Antarctic ice sheet mass balance and thus global sea-level change.
Biologically, the Southern Ocean is a high-productivity area with high biodiversity.
It is also one of the most remote and harshest areas of the world with extensive sea-ice cover and year-round severe weather conditions.
Despite its remoteness and hostility, human activities are increasingly extending into this distant part of the world, examples including research, fisheries, and tourism.
Precise bathymetric information are paramount to better understand the Southern Ocean and its processes as well as for human activities and conservation and management measures.
“No matter where you travel or work, you need a map for orientation,” said Dr. Boris Dorschel-Herr, head of bathymetry with the Alfred Wegener Institute at the Helmholtz Centre for Polar and Marine Research.
“That’s why virtually all oceanographic disciplines rely on detailed maps of the ocean floor.”
“For example, the seafloor topography of the Southern Ocean is essential to understanding a range of climate-relevant processes.”
“Warm water masses flow into deep troughs in the continental shelf towards the ice shelves and glaciers of the Antarctic, affecting how they melt.”
“Conversely, the stability and calving behavior of glaciers and ice sheets greatly depend on the features of the ground beneath them.”
“With the IBCSO v2, we have delivered the best and most detailed representation of the Southern Ocean to date.”
The first IBCSO map (IBCSO v1) of the area south of 60°S was released in 2013.
“The new version of IBCSO now covers the entire area south of the 50th parallel — which means 2.4 times as much seafloor as the first version — at a high resolution of 500 by 500 m,” Dr. Dorschel-Herr said.
“As a result, the Antarctic Circumpolar Current and the key oceanographic ‘gateways’ essential to understanding it — the Drake Passage and the Tasmanian Passage — are included in their entirety.”
“The chart is based on more than 25.5 billion measurements supplied by 88 institutions in 22 countries.”
The map and the complex methods used to create it were described in the journal Scientific Data and the information system PANGAEA.
_____
Boris Dorschel et al. 2022. The International Bathymetric Chart of the Southern Ocean Version 2. Sci Data 9, 275; doi: 10.1038/s41597-022-01366-7
Boris Dorschel et al. 2022. The International Bathymetric Chart of the Southern Ocean Version 2 (IBCSO v2). PANGAEA, doi: 10.1594/PANGAEA.937574