Using radar and infrared data from NASA’s Cassini orbiter spacecraft, a team of planetary geologists has identified and mapped the major geological units on Titan’s surface.

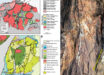
The global geologic map of Titan. The map projections are Mercator (top) and polar stereographic (bottom, for >55° N and °S). Image credit: NASA / JPL-Caltech / ASU.
Titan is a carbon-rich, oxygen-poor world with a wide range of organic and inorganic compounds, atmospheric energy sources, and liquid hydrocarbon seas and lakes.
It is the only planetary body in our Solar System, except our planet, where rainfall and seasonally flowing liquids erode the landscape.
In addition to a hazy mixture of nitrogen and hydrocarbons like methane and ethane, the atmosphere of this strangely Earth-like world also contains an array of more complex organic molecules.
“Titan has an active methane-based hydrologic cycle that has shaped a complex geologic landscape, making its surface one of most geologically diverse in the Solar System,” said Dr. Rosaly Lopes, a planetary geologist at NASA’s Jet Propulsion Laboratory.
“Despite the different materials, temperatures and gravity fields between Earth and Titan, many surface features are similar between the two worlds and can be interpreted as products of the same geologic processes.”
“The new map shows that the different geological terrains have a clear distribution with latitude, globally, and that some terrains cover far more area than others.”

The global geologic map of Titan in a Mollweide projection. Lines mark 30 degrees of latitude and longitude. The map is centered on 0 degrees latitude, 180 degrees longitude. Map scale is 1:20,000,000. Labels point to several of the named surface features. Also located is the landing site of ESA’s Huygens probe, part of NASA’s Cassini mission. Image credit: NASA / JPL-Caltech / ASU.
Dr. Lopes and colleagues used data from Cassini, which operated between 2004 and 2017 and did more than 120 flybys of Titan.
Specifically, they used data from Cassini’s radar imager to penetrate Titan’s opaque atmosphere of nitrogen and methane.
In addition, they used data from Cassini’s visible and infrared instruments, which were able to capture some of Titan’s larger geologic features through the methane haze.
“This study is an example of using combined data sets and instruments,” Dr. Lopes said.
“Although we did not have global coverage with synthetic aperture radar (SAR), we used data from other instruments and other modes from radar to correlate characteristics of the different terrain units, so we could infer what the terrains are even in areas where we don’t have SAR coverage.”
“The Cassini mission revealed that Titan is a geologically active world, where hydrocarbons like methane and ethane take the role that water has on Earth,” added Dr. David Williams, a planetary geologist at Arizona State University.
“These hydrocarbons rain down on the surface, flow in streams and rivers, accumulate in lakes and seas, and evaporate into the atmosphere. It’s quite an astounding world!”
The map and the team’s findings were published in a paper in the journal Nature Astronomy.
_____
R.M.C. Lopes et al. A global geomorphologic map of Saturn’s moon Titan. Nat Astron, published online November 18, 2019; doi: 10.1038/s41550-019-0917-6