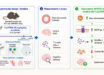
An international group of scientists led by the University of Kansas has created a detailed map that shows areas of the world most likely to see cases of Zika virus disease.

This map predicts the likelihood of Zika exposure in the coming years. Image credit: Abdallah M. Samy et al.
The map was published online as part of a paper in the journal Memórias do Instituto Oswaldo Cruz.
“It’s the first detailed map that weighs different drivers of transmission,” said lea author Dr. Abdallah Samy, from the University of Kansas and the Ain Shams University in Cairo, Egypt.
“We assessed different combinations of variables to see what are the major drivers – such as climate, or socioeconomics or people’s ability to access certain areas – and in the final map we merge all the variables.”
The resulting map predicts the likelihood of Zika exposure in the coming years by segmenting Earth’s landmasses into squares of 3.1 x 3.1 miles (5 x 5 km) each and crunching the numbers for each of them.
Multiple factors influence risk assessment because the virus can spread through contact with mosquitoes in the genus Aedes, person-to-person via sexual contact, through blood transfusions and mother-to-child during pregnancy. The study focused on mosquito-driven transmission.
Dr. Samy said: “for each area, we asked, ‘is it mosquito exposure, climate or socioeconomic variables like accessibility for people to travel from areas where Zika is endemic and spread the virus upon their return?”
The map can be used by public health officials and international organizations that combat disease.

Close-up of North America: parts of the southern U.S., including parts of Florida, Texas and Louisiana, are vulnerable to transmission of Zika virus. Image credit: Abdallah M. Samy et al.
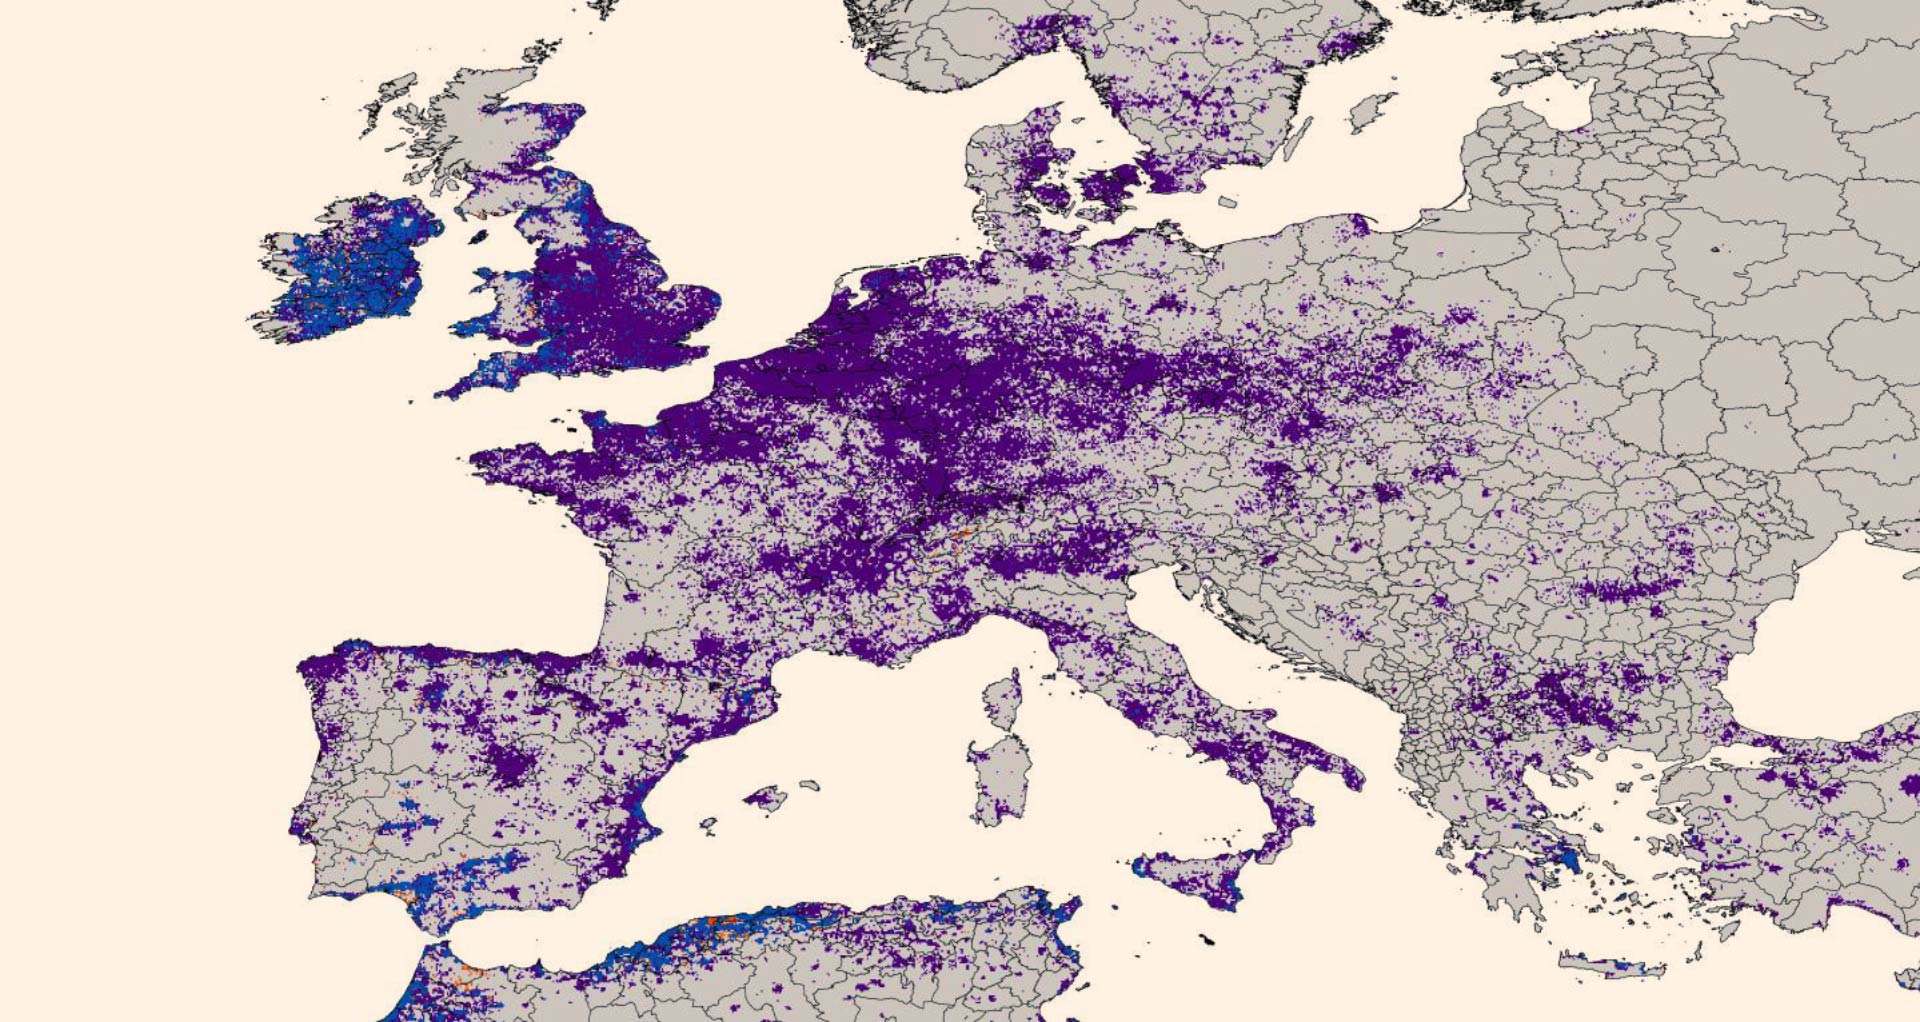
Close-up of Europe. Image credit: Abdallah M. Samy et al.
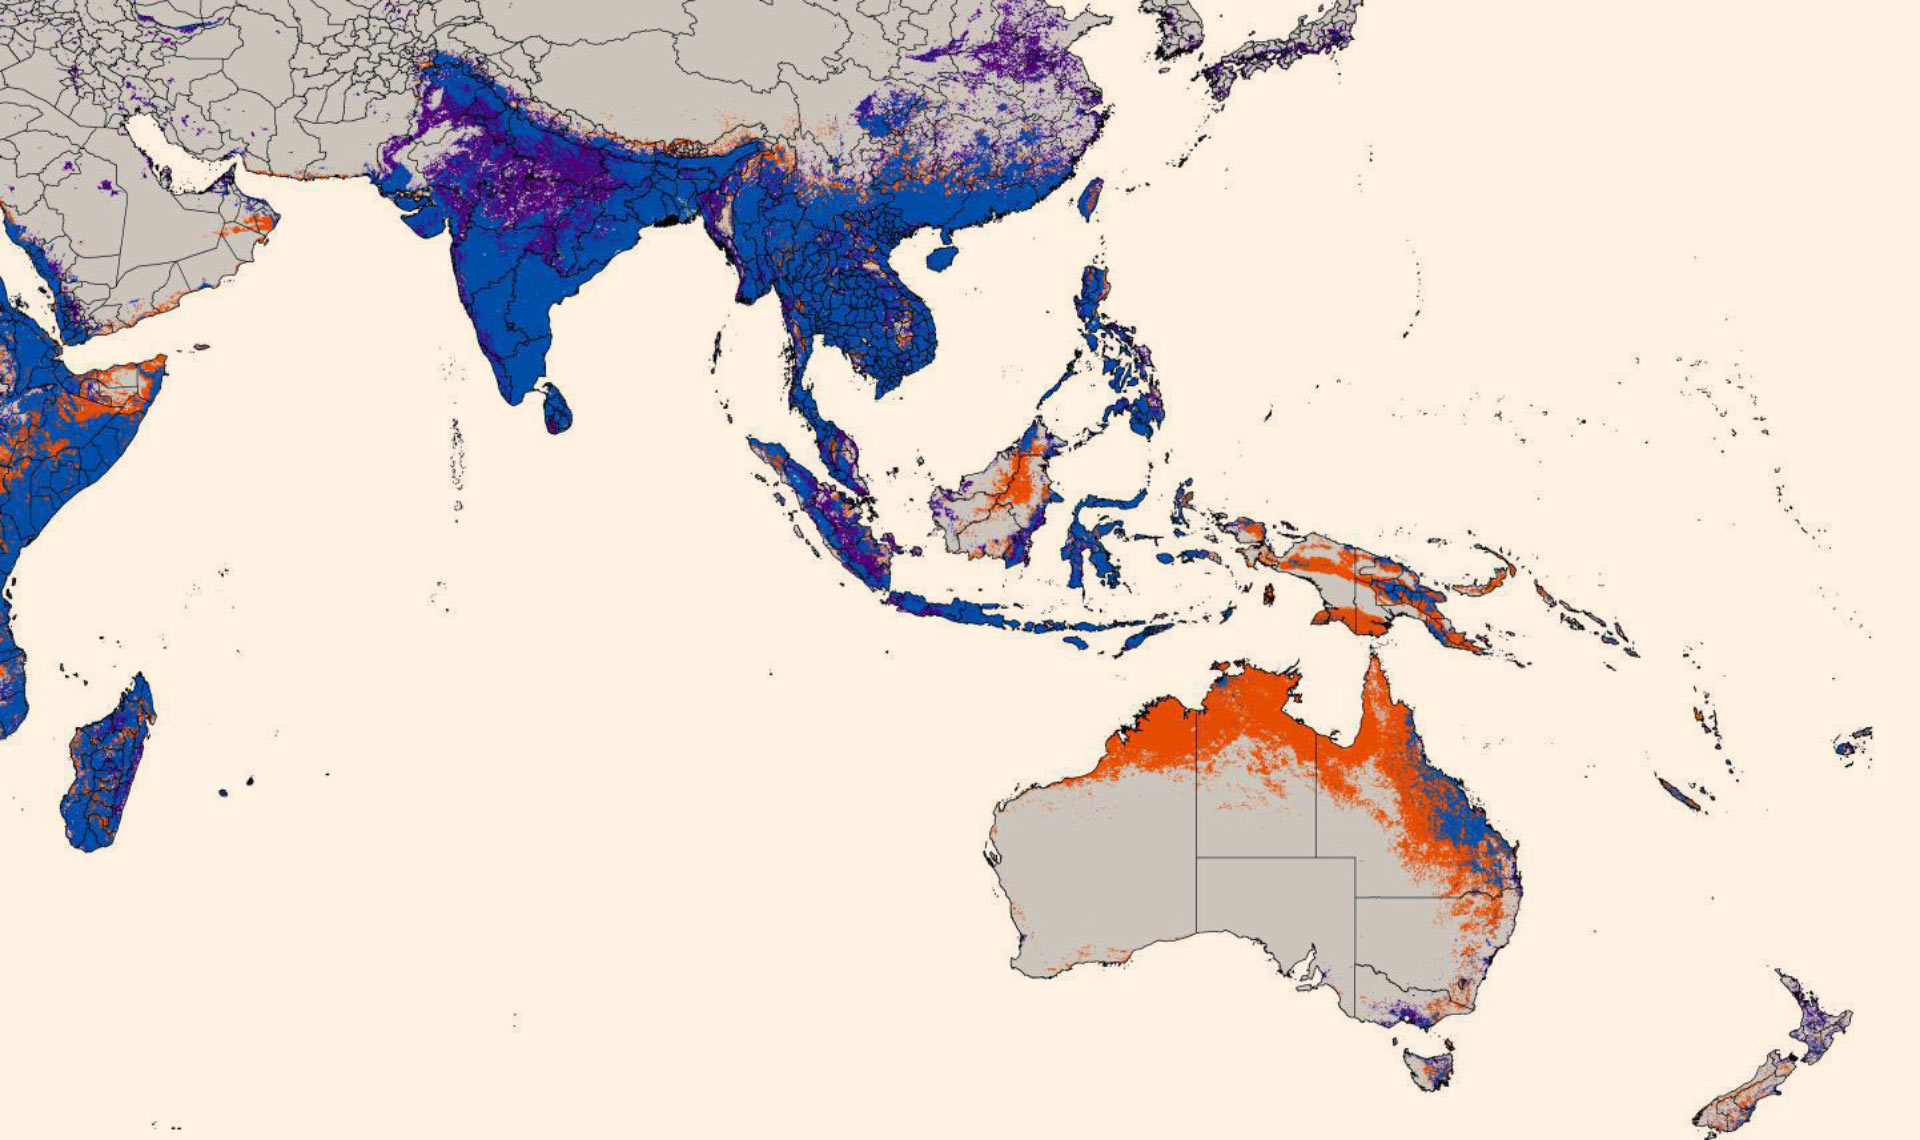
Close-up of Asia and Australia. Image credit: Abdallah M. Samy et al.
“It’s also intended for the public. If you’re going to travel to a specific area in Brazil, and you know it’s a risk area for Zika, you should consider how to reduce the chances of transmission with clothing or insect repellant,” Dr. Samy added.
“The course of the outbreak thus far is similar to what his team’s map predicts with a high degree of specificity,” he said.
“We have multiple dimensions in our models, and in addition we use accurate algorithms to account for bias. So far, the pattern of spread of cases mostly conform with our model.”
_____
Abdallah M. Samy et al. Mapping the global geographic potential of Zika virus spread. Mem. Inst. Oswaldo Cruz, published online April 15, 2016; doi: 10.1590/0074-02760160149