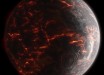
A new computer model called GEOS-5 has provided a high-resolution look at how carbon dioxide (CO2) – the key driver of global warming – moves around the globe and fluctuates in volume throughout the year.

GEOS-5 has given researchers a stunning new look at how CO2 in the atmosphere travels around the globe. Image credit: NASA’s Goddard Space Flight Center / K. Sharghi.
This particular simulation is called Nature Run. It is the product of the Goddard Earth Observing System Model, Version 5 (GEOS-5), a computer model created by researchers with the Global Modeling and Assimilation Office at NASA’s Goddard Space Flight Center, Greenbelt, Maryland.
The simulation is the first to show in such fine detail how carbon dioxide actually moves through the atmosphere of our planet. It has about 64 times greater resolution than most global climate models.
In the Nature Run, real data on emissions and atmospheric conditions is ingested by the model, which is then left to run on its own to simulate the behavior of Earth’s atmosphere for a two-year period – in this case, May 2005 to June 2007.
It produced nearly 4 petabytes of data and required 75 days of dedicated computation to complete.
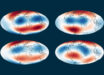
The colors represent a range of carbon dioxide concentrations, from 375 (dark blue) to 395 (light purple) parts per million.
The red represents about 385 parts per million. White plumes represent carbon monoxide emissions.
“While the presence of carbon dioxide has dramatic global consequences, it’s fascinating to see how local emission sources and weather systems produce gradients of its concentration on a very regional scale. Simulations like this, combined with data from observations, will help improve our understanding of both human emissions of carbon dioxide and natural fluxes across the globe,” said project’s lead scientist Dr Bill Putman of NASA’s Goddard Space Flight Center in Greenbelt, Maryland.
“We’re very excited to share this revolutionary dataset with the modeling and data assimilation community and we hope the comprehensiveness of this product and its ground-breaking resolution will provide a platform for research and discovery throughout the Earth science community.”
In addition to providing a striking visual description of the movements of an invisible gas like carbon dioxide, as it is blown by the winds, this kind of simulation will help scientists better project future climate.
Engineers can also use this model to test new satellite instrument concepts to gauge their usefulness. The model allows engineers to build and operate a ‘virtual’ instrument inside a computer.
Using GEOS-5 in tests known as Observing System Simulation Experiments (OSSE) allows scientists to see how new satellite instruments might aid weather and climate forecasts.
“While researchers working on OSSEs have had to rely on regional models to provide such high-resolution Nature Run simulations in the past, this global simulation now provides a new source of experimentation in a comprehensive global context. This will provide critical value for the design of Earth-orbiting satellite instruments,” Dr Putman concluded.
The results will be presented today at the SC14 Supercomputing Conference in New Orleans, Louisiana.
_____