A team of scientists from Indiana University and the professional network LinkedIn has created the first global map of labor flow.

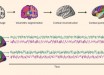
Park et al revealed large-scale associations between industries and people across the globe: (a) the large-scale organization of geo-industrial clusters in the labor flow network; each circle represents a geo-industrial cluster, with size proportional to its number of employees; the colors represent the highest-level community membership; (b-e) two examples of hierarchical sub-structures in the labor flow network are illustrated; each circle represents a firm and the bar charts show the reduction in industry and region entropy within the cluster as a proportion of the parent cluster’s entropy: (b, c) the organization of banking and financial geo-industrial clusters are affected more by industries than geography; (d, e) the geo-industrial clusters in U.S. Midwest and South region form strong geographical clusters. Image credit: Park et al, doi: 10.1038/s41467-019-11380-w.
“Our result represents a powerful tool for understanding the flow of people between industries and regions in the U.S. and beyond,” said study first author Jaehyuk Park of Indiana University and colleagues.
“It could also help policymakers better understand how to address critical skill gaps in the labor market or connect workers with new opportunities in nearby communities.”
The researchers created the map using LinkedIn’s data on professional demographics and employment histories from more than 500 million people between 1990 and 2015, including approximately 130 million job transitions between more than 4 million firms.
“Our access to these data was made possible by our selection as one of 11 teams selected to participate in the LinkedIn Economic Graph Challenge,” they explained.
The study showed some unexpected connections between economic sectors, such as the strong ties between credit card and airline industries.
It also identified growing industries during the study period from 2010 to 2014, including the pharmaceutical and oil and gas industries — with in-demand skills such as team management and project management — as well as declining industries, such as retail and telecommunications.
“We expect this study will provide a powerful foundation for further systematic analysis of geo-industrial clusters in the context of business strategy, urban economics, regional economics and international development fields,” Park and co-authors said.
“It will also provide useful insights for policymakers and business leaders.”
The findings were published in the journal Nature Communications.
_____
Jaehyuk Park et al. 2019. Global labor flow network reveals the hierarchical organization and dynamics of geo-industrial clusters. Nature Communications 10, article number: 3449; doi: 10.1038/s41467-019-11380-w