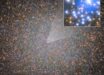
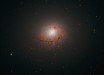
Astronomers using data from ESA’s Hipparcos space astrometry mission have produced a 3D visualization of all of O and B type stars within 1,630 light years of the Sun and in doing so have found evidence for new structures in the distribution of nearby hot stars.

Our Solar System is located at the center of the circle on this artist’s impression of the Milky Way Galaxy. The insert shows one view from the 3D visualization tool developed by the astronomers. Image credit: ESA / H. Bouy, CSIC-INTA / J. Alves, University of Vienna.
Massive O and B type stars – sometimes referred to as OB stars – live for a maximum of only a few tens of millions of years.
They are important markers of recent star formation and much can be learnt from studying their distribution in the solar neighborhood.
Previous studies have looked for groupings of OB stars by seeking out concentrations of them in 2D projections. Astronomers use these 2D projections to look at the position and velocity of the stars in a given region and pick out stars that are moving together, and are thus most likely members of the same stellar group.
“Mapping data from missions like Hipparcos in 2D has allowed us to identify and classify numerous stellar groups and has profoundly changed our knowledge and understanding of the solar vicinity,” said Dr Hervé Bouy from the Center for Astrobiology in Spain, lead author of a paper published today in the journal Astronomy & Astrophysics.
“But it comes with significant drawbacks. 2D projections are just not capable of describing all the features of 3D space and using them to model distributions can cause artificial structures to appear and important structures to be hidden in the projection and lost.”
“Our study has shown just how different the architecture of the solar neighborhood looks when mapped in 3D,” added co-author Dr João Alves, an astronomer at the University of Vienna in Austria.
Dr Bouy and Dr Alves constructed a 3D map of the spatial density of OB stars within 1,630 light-years from the Sun and found three large-scale stream-like structures that allow a new view on the solar neighborhood.
The three streams are (i) the Scorpius to Canis Majoris stream, covering 1,142 light-years and 65 million years of star formation history; (ii) the Vela stream, encompassing at least 490 light-years and 25 million years of star formation history; and (iii) the Orion stream, including not only the well-known Orion OB1 associations, but also a large previously unreported foreground stellar group lying only 652 light-years from the Sun.
Although all three of the newly-discovered streams have a story to tell, it is the Orion stream that is perhaps the most significant due to its mystery-solving qualities.
The origin of the blue supergiants that define the body and belt of the Orion constellation has long been a mystery.
The five OB stars are located between 250 and 800 light years from us and as a result it was assumed that their origin was not, despite their name, in the prolific Orion Nebula star-forming region, which lies around 1,300 light years from Earth.
However, the discovery of the Orion stream offers a simple solution. It implies that these relatively distant populations are in fact linked as part of a large galactic structure.
“One exciting find from this study relates to Betelgeuse, the red giant in the arm of Orion,” Dr Bouy said.
“The origin of this star has always been shrouded in mystery but through this study we have uncovered a new loosely organized OB association, named Taurion, which we believe to be Betelgeuse’s birthplace and to contain its sibling stars.”
By using 3D data analysis, the astronomers have not only uncovered the previously unknown, they may also have identified a significant visual illusion produced by 2D methods.
In 1879, British astronomer John Herschel and then American astronomer Benjamin Gould identified a 3,000 light-year-long partial ring of OB stars – the Gould Belt.
Now, Dr Bouy and Dr Alves have shown that when mapped in 3D this model does not in fact provide a good fit for the distribution of OB stars, potentially disproving the existence of this belt and calling for a new interpretation of stellar groups in the solar neighborhood.
“The Gould Belt is the perfect example of how 2D projections can deceive astronomers,” Dr Alves said.
“Our results imply that it is just a projection effect produced by the Sun’s position between two of the streams of stars, rather than representing the architecture of the solar neighborhood itself.”
_____
H. Bouy & J. Alves. Cosmography of OB stars in the solar neighbourhood. A&A 584, A26; doi: 10.1051/0004-6361/201527058