Researchers using data from the Dark Energy Camera (DEC) – an imaging device that is the primary instrument for the Dark Energy Survey – have created the first in a series of dark matter maps of the cosmos.

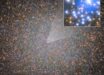
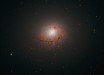
This map shows the detailed distribution of dark matter across a large area of sky. The color scale represents projected mass density: red and yellow represent regions with more dense matter. Clusters of galaxies are represented by gray dots on the map – bigger dots represent larger clusters. The insets are images of two galaxy clusters and a cosmic void. Image credit: Dark Energy Survey.
Dark matter is a hypothetical form of matter that is undetectable by its emitted electromagnetic radiation but accounts for most of the matter in the Universe.
The first evidence for its existence emerged in the 1930s when Swiss astronomer Dr Fritz Zwicky observed the Coma Cluster (Abell 1656) – a large cluster of galaxies that contains over 1,000 identified galaxies, all gravitationally bound to one another.
He looked at how many galaxies were visible and made an estimate of the total amount of matter in the cluster. He also measured the velocities of some of the galaxies in the cluster, and deduced that many of them were moving very fast – so fast, in fact, that they should have been able to escape the gravitational pull of the other galaxies in the cluster and escape into deep space. Dr Zwicky concluded that the cluster was much more massive than he had calculated, and that much of the cluster’s mass was invisible.
The most interesting thing about dark matter is not simply that astronomers can’t see it, it’s that they know dark matter is not made of the same stuff as normal matter, and only interacts through gravity. This is why scientists see its effects on the motions of galaxies and stars, but why they can’t see it directly; it does not emit or absorb light.
Understanding the role of dark matter is part of the research program to quantify the role of dark energy, which is the ultimate goal of the Dark Energy Survey (DES).
The new map, created by Vinu Vikram of Argonne National Laboratory and his colleagues, makes use of early DES observations and covers only 3% of the area of sky DES will document over its 5-year project.
“We measured the barely perceptible distortions in the shapes of about 2 million galaxies to construct these new maps,” Dr Vikram said.
“They are a testament not only to the sensitivity of the DEC, but also to the rigorous work by our lensing team to understand its sensitivity so well that we can get exacting results from it.”
The map shows large filaments of matter along which visible galaxies and galaxy clusters lie and cosmic voids where very few galaxies reside.
Follow-up studies of some of the enormous filaments and voids will reveal more about this interplay of mass and light.
“Our analysis so far is in line with what the current picture of the universe predicts. Zooming into the DES maps, we have measured how dark matter envelops galaxies of different types and how together they evolve over cosmic time. We are eager to use the new data coming in to make much stricter tests of theoretical models,” said team member Dr Chihway Chang of ETH Zurich.
The results were released today at the April 2015 Meeting of the American Physical Society in Baltimore, Maryland, and will be published in the Monthly Notices of the Royal Astronomical Society (arXiv.org preprint).
_____
V. Vikram et al. 2015. Wide-Field Lensing Mass Maps from DES Science Verification Data. Mon. Not. R. Astron. Soc., to be published; arXiv: 1504.03002