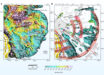
A team of scientists from Europe, the United States, Canada, South Korea, Greenland and China has produced the most detailed depth map of the Arctic Ocean to date.

The International Bathymetric Chart of the Arctic Ocean Version 4.0. Image credit: Jakobsson et al, doi: 10.1038/s41597-020-0520-9.
The new map, named the International Bathymetric Chart of the Arctic Ocean Version 4.0, has more than twice the resolution (200 by 200 m versus 500 by 500 m) than the previous version released in 2012.
“This map is this year’s contribution to the Nippon Foundation-GEBCO Seabed 2030, whose objective is to map all seas and oceans in the world by 2030,” said team member Professor Martin Jakobsson, a researcher in the Department of Geological Sciences and the Bolin Centre for Climate Research at the Stockholm University.
“We contributed to the map with data mainly obtained through the multibeam bathymetry in oceanographic campaigns in the Arctic, especially in the western area in the Barents Sea,” said Professor Miquel Canals, a scientist in the Department of Earth and Ocean Dynamics at the Universidad de Barcelona.
“These data come from oceanographic vessels, ice breakers and nuclear submarines, the only ones to map those areas under the iced sea, impossible to reach with other ships.”
The new bathymetric map has substantially more seafloor morphological information that offers new insights into a range of submarine features and processes.
For example, the improved portrayal of Greenland fjords will better serve predictive modeling of the fate of the Greenland Ice Sheet.
“In general, a better and larger cartography helps to broaden the knowledge on the geological and glacial evolution of such a sensitive region like the Arctic,” Professor Canals said.
“Therefore, the new map identifies a great variety of shapes of the relief with glacial origins, some at large scales, that shows the direction of the ice movement on the ocean floors and helps reconstruct the geological processes of the recent past in Arctic latitudes.”
“Bathymetrical data are relevant in other fields of polar science, such as the study of the path of ocean currents — and therefore, the distribution of the heat — the sea-ice decline, the effect of inflowing warm waters on tidewater glaciers, and the stability of marine based ice streams and outlet glaciers grounded on the seabed,” he said.
“One of the most spectacular formations in the Arctic Ocean is the Lomonosov Ridge, an unusual underwater ridge that extends over 1,600 km across the central Arctic Ocean between the continental shelves of Northern Greenland and Siberia.”
“The most recent cartography studies carried out with ice breakers, revealed the presence of thresholds that influence the exchange of water between both basins, and anchoring marks in ice platforms on the ridge.”
The new bathymetric map of the Arctic Ocean is described in a paper in the journal Scientific Data.
_____
M. Jakobsson et al. 2020. The International Bathymetric Chart of the Arctic Ocean Version 4.0. Sci Data 7, 176; doi: 10.1038/s41597-020-0520-9