Researchers from Australia, the United States and the United Kingdom using an autonomous underwater vehicle known as the SeaBED have created the first high-resolution, three-dimensional maps of Antarctic sea ice. The results, published online in the journal Nature Geoscience, step up the pace of research in the polar regions aimed at understanding the dramatic sea ice changes in the context of climate change.

SeaBED seen under the sea ice. Image credit: Klaus Meiners / Woods Hole Oceanographic Institution.
Scientists use a range of technologies to measure sea ice thickness.
Satellite observations can measure large-scale thickness from space, but interpreting the data accurately can be difficult due to snow cover on the ice.
Measurements made on the sea ice by drilling holes, together with visual observations from ships are critical for building a more complete picture, but difficulties in getting access to thicker areas of sea ice leaves gaps in the data.
Now, with the SeaBED, scientists have an invaluable new tool to fill this gap.
“The successful SeaBED deployment is an important first step toward making the kinds of routine underwater measurements needed to help monitor and understand large-scale changes in sea ice,” said co-author Dr Ted Maksym of Woods Hole Oceanographic Research Institution.
“What this effort does is show that observations from autonomous underwater vehicles under the ice are possible and there is a very rich data set that you can get from them.”
“This work is an important step toward making the kinds of routine measurements we need in order to really monitor and understand what’s happening with the ice and the large scale changes that are occurring.”
While most oceanographic survey instruments look down at the seafloor, SeaBED was fitted with an upward-looking sonar in order to measure and map the underside of sea ice floes.
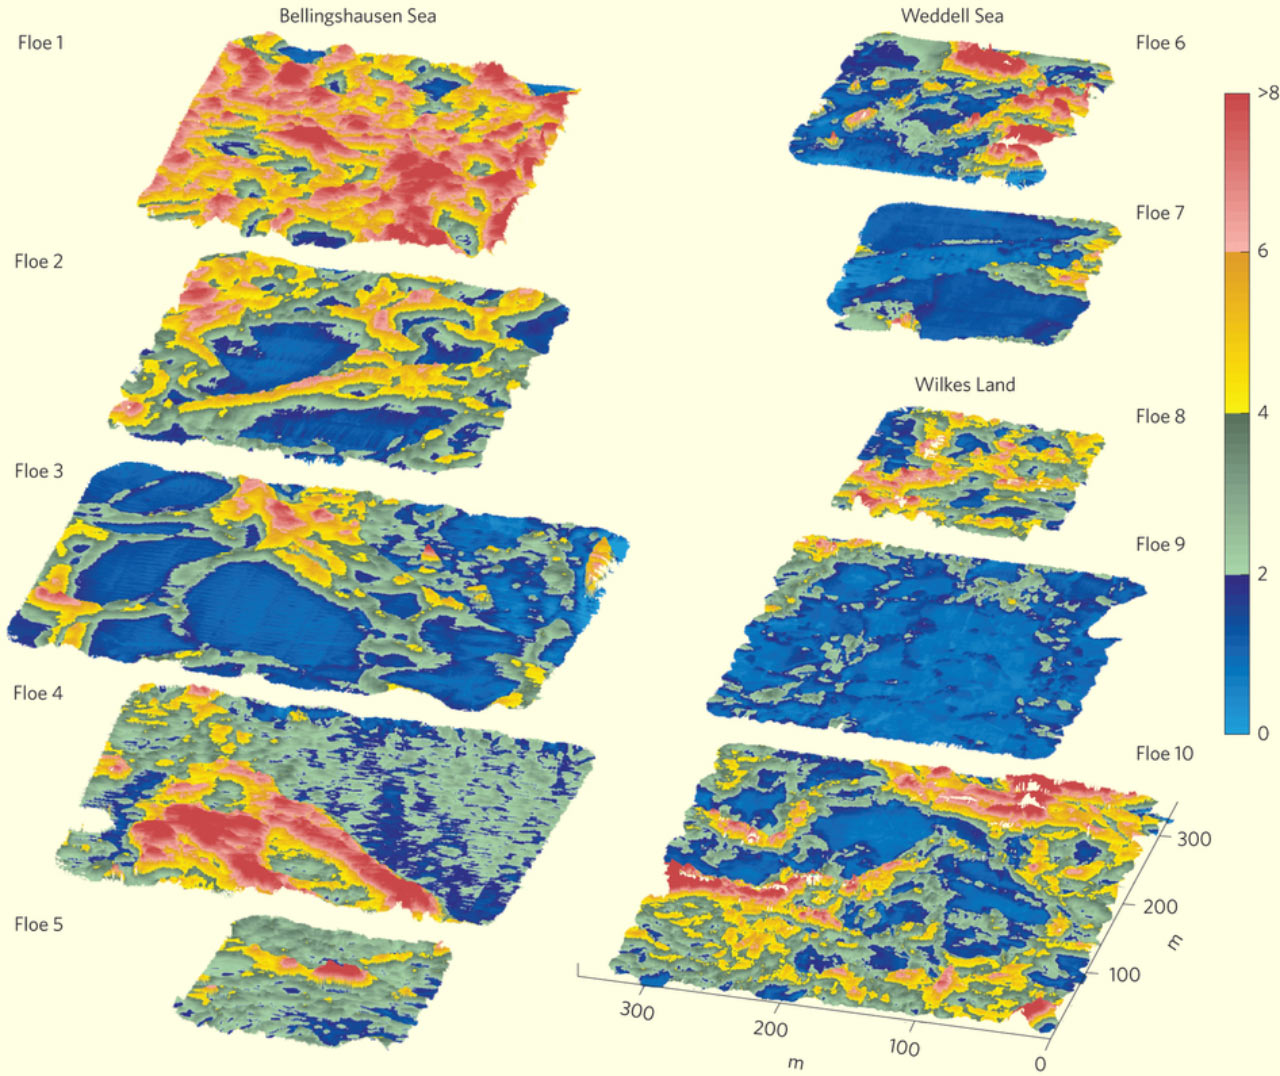
3D floe-scale sea-ice draft maps: floes 1–5 from the Bellingshausen sector; floes 6–7 from the Weddell sector; floes 8–10 from Wilkes Land, East Antarctica; the color scale is sea-ice draft (m); horizontal scale is shown for floe 10. Image credit: G. Williams et al.
The vehicle, which is about 2 meters long and weighs nearly 200 kg, operated at a depth of 20 to 30 meters and was driven in a ‘lawnmower pattern.’ These lines of data were merged to form high-resolution 3-D bathymetric surveys of the underside of the ice.
The scientists deployed the SeaBED as part of two Antarctic cruises in 2010 and 2012 in the austral spring.
First on the British Antarctic Survey’s RRS James Clark Ross and the second on the Australian icebreaker the RSV Aurora Australis.
Three locations around the Antarctic Peninsula were mapped – the Weddell, Bellingshausen and Wilkes Land sectors – covering an area of 500,000 sq. m.
The next steps are for the scientists to do large-scale surveys that can be compared to large-scale observations from aircraft and satellites.
_____
G. Williams et al. Thick and deformed Antarctic sea ice mapped with autonomous underwater vehicles. Nature Geoscience, published online November 24, 2014; doi: 10.1038/ngeo2299