Using spectral data from the Hobby-Eberly Telescope at McDonald Observatory, astronomers have produced the most detailed 3D map yet of faint cosmic structures from 9-11 billion years ago, revealing galaxies and intergalactic gas once invisible to telescopes.
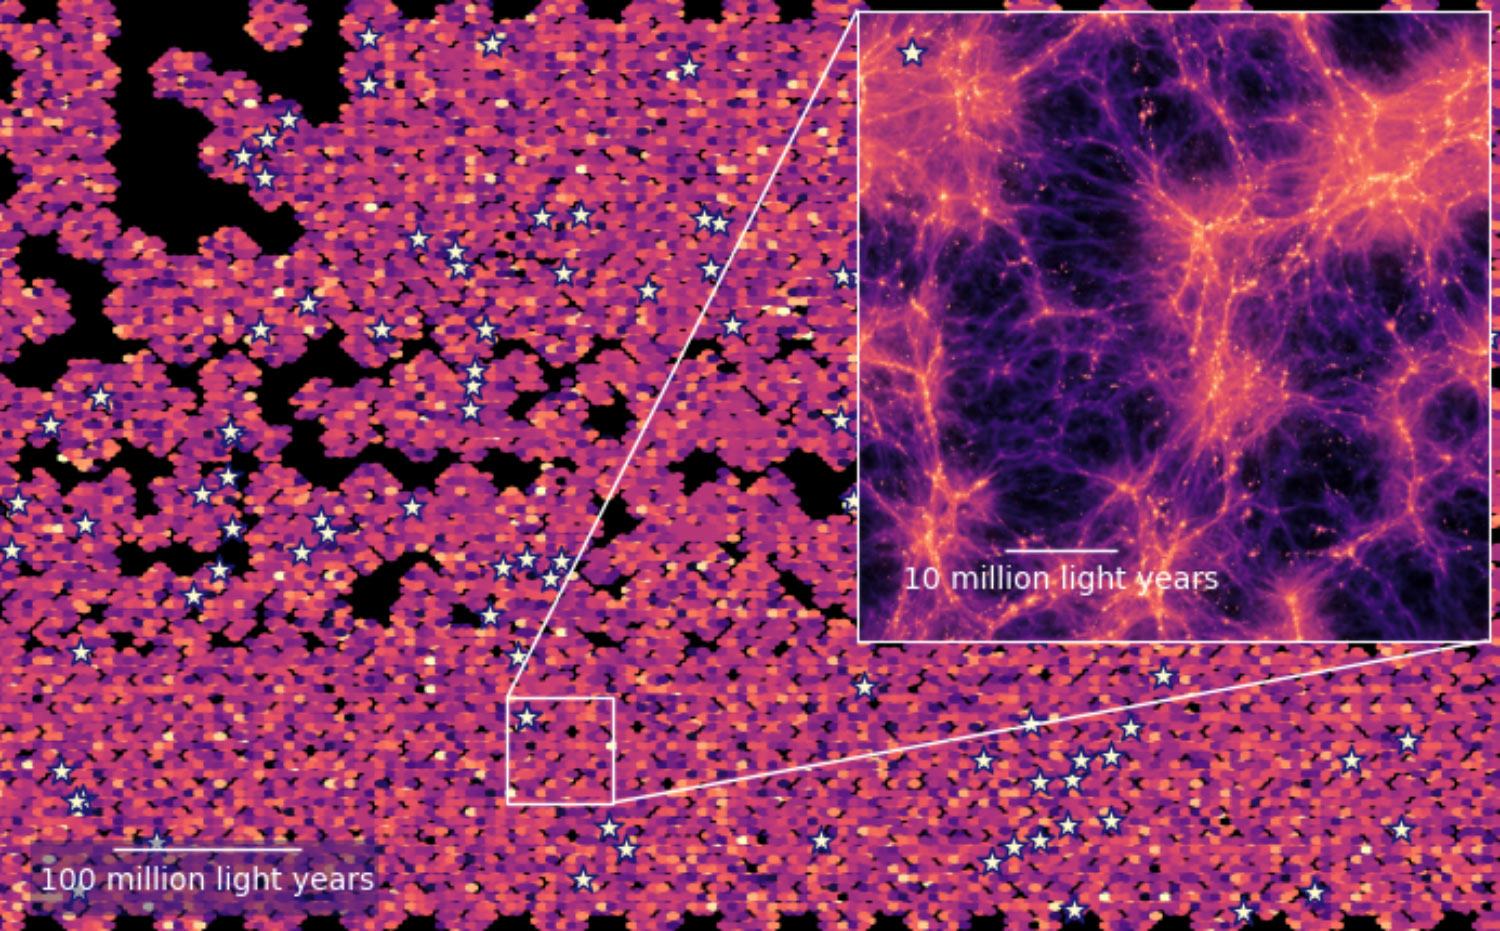
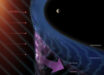
Section of the Line Intensity Map created by charting the distribution and concentration of excited hydrogen (via the Lyman alpha wavelength) in the Universe around 10 billion years ago. The stars mark where HETDEX has found galaxies. The inset simulates the structure present in this map once it is zoomed in on and background noise is removed from the data. Image credit: Maja Lujan Niemeyer / Max Planck Institute for Astrophysics / HETDEX / Chris Byrohl / Stanford University.
“Observing the early Universe gives us an idea of how galaxies evolved into their current form, and what role intergalactic gas played in this process,” said Dr. Maja Lujan Niemeyer, an astronomer at the Max-Planck-Institut für Astrophysik and the Ludwig-Maximilians-Universität München and a member of the Hobby-Eberly Telescope Dark Energy Experiment (HETDEX).
“But because they are far away, many objects in this time are faint and difficult to observe.”
“Using a technique called Line Intensity Mapping, the new map pulls these objects into view, adding shape and nuance to this formative era in our Universe.”
Although Line Intensity Mapping isn’t a new technique, this is the first time it’s been used to chart Lyman alpha emissions in such a large set of data and with such high precision.
Using the Hobby-Eberly Telescope, the HETDEX project is charting the position of over one million bright galaxies in its quest to understand dark energy.
The project is unique in gathering so much data — over 600 million spectra — for such a large swath of sky, measuring over 2,000 full Moons.
“However, we only use a small fraction of all the data we collect, around 5%,” said HETDEX principal investigator Dr. Karl Gebhardt, an astronomer at the University of Texas at Austin.
“There’s huge potential in using that remaining data for additional research.”
“HETDEX observes everything in a patch of sky, but only a tiny amount of that data is related to the galaxies that are bright enough for the project to use,” Dr. Lujan Niemeyer said.
“But those galaxies are only the tip of the iceberg. There’s a whole sea of light in the seemingly empty patches in between.”
To create its map, the astronomers used supercomputers at the Texas Advanced Computing Center to sift through roughly half a petabyte of HETDEX data.
It then used the location of bright galaxies already identified by HETDEX to calculate the location of fainter galaxies and gas glowing nearby.
Thanks to gravity’s propensity for making matter clump together, where there is one bright galaxy, other objects are sure to be close.
“So, we can use the location of known galaxies as a signpost to identify the distance of the fainter objects,” said HETDEX scientist Dr. Eiichiro Komatsu, an astronomer at the Max-Planck-Institut für Astrophysik.
“The resulting map brings the regions around bright galaxies into greater focus and adds detail to the stretches in between.”
“We have computer simulations of this period. But those are just simulations, not the real Universe.”
“Now we have a foundation which can let us know if some of the astrophysics underpinning those simulations is correct.”
The findings were published March 3, 2026 in the Astrophysical Journal.
_____
Maja Lujan Niemeyer et al. 2026. Lyα Intensity Mapping in HETDEX: Galaxy-Lyα Intensity Cross-power Spectrum. ApJ 999, 177; doi: 10.3847/1538-4357/ae3a98