Astronomers from the Baryon Oscillation Spectroscopic Survey (BOSS, part of the Sloan Digital Sky Survey III) have produced the largest-ever 3D map of distant galaxies and used it to make one of the most precise measurements yet of the dark energy.

This is one slice through the map of the large-scale structure of the Universe from the Baryon Oscillation Spectroscopic Survey. Each dot in this picture indicates the position of a galaxy 6 billion years into the past. The image covers about 1/20th of the sky, a slice of the Universe 6 billion light-years wide, 4.5 billion light-years high, and 500 million light-years thick. Color indicates distance from Earth, ranging from yellow on the near side of the slice to purple on the far side. Galaxies are highly clustered, revealing superclusters and voids whose presence is seeded in the first fraction of a second after the Big Bang. This image contains 48,741 galaxies, about 3% of the full survey dataset. Grey patches are small regions without survey data. Image credit: Daniel Eisenstein / SDSS-III Collaboration.
“We have spent a decade collecting measurements of 1.2 million galaxies over one quarter of the sky to map out the structure of the Universe over a volume of 650 cubic billion light years,” explained team member Dr. Jeremy Tinker, of New York University.
“This map has allowed us to make the best measurements yet of the effects of dark energy in the expansion of the Universe. We are making our results and map available to the world.”
The map revealed by BOSS allows scientists to measure the expansion rate of the Universe and determine the amount of matter and dark energy that make up the present-day Universe.
According to Dr. Tinker and his colleagues, BOSS measures the expansion rate of the Universe by determining the size of the baryon acoustic oscillations (BAO) in the 3D distribution of galaxies.
The original BAO size is determined by pressure waves that travelled through the young Universe up to when it was only 400,000 years old, at which point they became frozen in the matter distribution of the Universe.
The result is that galaxies are preferentially separated by a characteristic distance, that astronomers call the acoustic scale.
The size of the acoustic scale at 13.48 billion years ago has been exquisitely determined from observations of the cosmic microwave background from the light emitted when the pressure waves became frozen.
Measuring the distribution of galaxies since that time allows astronomers to measure how dark matter and dark energy have competed to govern the rate of expansion of the Universe.
“Measuring the acoustic scale across cosmic history gives a direct ruler with which to measure the Universe’s expansion rate,” said team member Dr. Ariel Sanchez, of the Max-Planck Institute of Extraterrestrial Physics.
“With BOSS, we have traced the BAO’s subtle imprint on the distribution of galaxies spanning a range of time from 2 to 7 billion years ago.”
“If we were to scale the volume of our survey to a cube 1 mile on each side, then the visible part of an individual galaxy would be about 1 mm across,” said team member Dr. Rita Tojeiro, from the University of St. Andrews.
“Our challenge in the analysis of this map was equivalent to measuring the distances between all the pairs of galaxies separated by 100 yards throughout a cubic mile of space.”
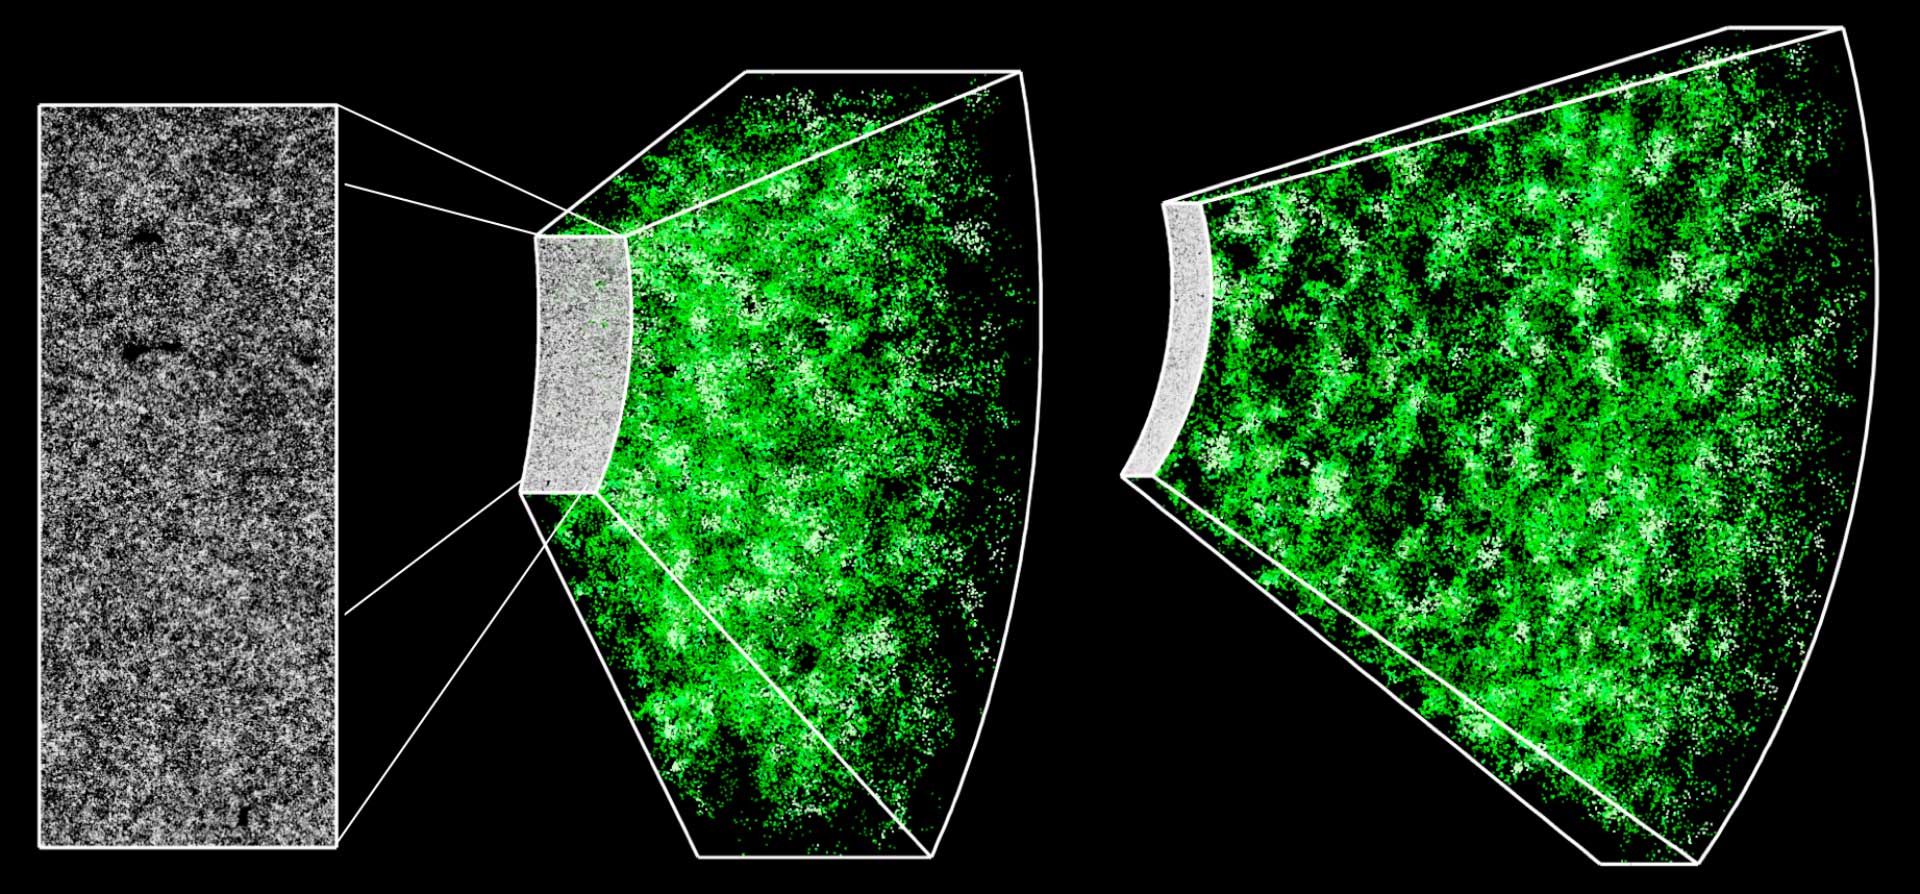
A section of the 3D map constructed by BOSS. The rectangle on the far left shows a cutout of 1,000 sq. degrees in the sky containing nearly 120,000 galaxies, or roughly 10% of the total survey. The spectroscopic measurements of each galaxy — every dot in that cutout — transform the 2D picture into a 3D map, extending our view out to 7 billion years in the past. The brighter regions in this map correspond to the regions of the Universe with more galaxies and therefore more dark matter. The extra matter in those regions creates an excess gravitational pull, which makes the map a test of Einstein’s theory of gravity. Image credit: Jeremy Tinker / SDSS-III Collaboration.
To measure the size of these ancient giant waves to such sharp precision, BOSS had to make an unprecedented and ambitious galaxy map, many times larger than previous surveys.
At the time the BOSS program was planned, dark energy had been previously determined to significantly influence the expansion of the Universe starting about 5 billion years ago.
BOSS was thus designed to measure the BAO feature from before this point (7 billion years ago) out to near the present day (2 billion years ago).
“If dark energy has been driving the expansion of the Universe over that time, our maps tell us that it is evolving very slowly if at all: the change is at most 20% over the past seven billion years,” said team member Dr. Florian Beutler, from the University of Portsmouth.
“Our latest results tie into a clean cosmological picture, giving strength to the standard cosmological model that has emerged over the last eighteen years.”
“We see a dramatic connection between the sound wave imprints seen in the cosmic microwave background 400,000 years after the Big Bang to the clustering of galaxies 7-12 billion years later,” Dr. Tojeiro said.
“The ability to observe a single well-modeled physical effect from recombination until today is a great boon for cosmology.”
The map also reveals the distinctive signature of the coherent movement of galaxies toward regions of the Universe with more matter, due to the attractive force of gravity.
Crucially, the observed amount of infall is explained well by the predictions of general relativity.
This agreement supports the idea that the acceleration of the expansion rate is driven by a phenomenon at the largest cosmic scales, such as dark energy, rather than a breakdown of our gravitational theory.
The astronomers have submitted their results to the journal Monthly Notices of the Royal Astronomical Society.
_____
Shadab Alam et al. 2016. The clustering of galaxies in the completed SDSS-III Baryon Oscillation Spectroscopic Survey: cosmological analysis of the DR12 galaxy sample. MNRAS, submitted for publication; arXiv: 1607.03155
Marcos Pellejero-Ibanez et al. 2016. The clustering of galaxies in the completed SDSS-III Baryon Oscillation Spectroscopic Survey: double-probe measurements from BOSS galaxy clustering & Planck data — towards an analysis without informative priors. MNRAS, submitted for publication; arXiv: 1607.03152