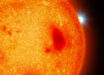
This illustration lays a depiction of the Sun’s magnetic fields over an image obtained by NASA’s Solar Dynamics Observatory (SDO) on March 12.

SDO image of the solar corona in UV light (yellow lines represent the magnetic field on the surface of the Sun). Image credit: NASA / SDO / AIA / LMSAL.
According to NASA scientists, the magnetic field of the Sun is volatile and constantly changing.
It is a multipole magnetic field (it has more than two poles) that can become very volatile and cause intense solar activity, including solar flares and eruptions. These events can causes disruptions to technological, navigation, and communication systems on our planet.
The SDO satellite is studying the magnetic fields of the Sun and solar activity to help scientists predict solar activity.
The new map was created using the Potential Field Source Surface model (PFSS), a model of the magnetic field in the solar atmosphere based on magnetic measurements of Sun’s surface.
“The PFSS model provides a simple and effective model for the large-scale features of the global coronal magnetic field,” according to Dr. Gordon Petrie from the National Solar Observatory.
“This model was originally developed by Schatten, Wilcox & Ness (1969) and Altschuler & Newkirk (1969), and refined by Hoeksema (1984) and Wang & Sheeley (1992).”
The underlying image was taken in extreme UV wavelengths of 171 angstroms. This type of light is invisible to our eyes, but is colorized in gold.
“The complex overlay of lines can teach us about the ways the solar magnetism changes in response to the constant movement on and inside the Sun,” said Steele Hill and Sarah Frazier from NASA’s Goddard Space Flight Center.
“Note how the magnetic fields are densest near the bright spots visible on the Sun – which are magnetically strong active regions – and many of the field lines link one active region to another.”